The CB Insights engineering team has been placing an increasingly large emphasis on system reliability and bug fixing to meet the demands of our growing customer base. However, a tangled web of noisy logs stood in the way. Here’s the low-down on the problem and how we went about fixing it.
The Problem
Recently we’ve been deploying code on a growing number of distributed servers and services to keep up with our growing user base. As a result of this shift, we found it increasingly difficult to track down and diagnose bugs in our system. The debugging process often required jumping between the browser, and multiple logs and servers to find the issue while using timestamps to estimate when and where the error occurred. This was time consuming and frustrating – time that could be better spent on cranking out new products.
The Solution
We added a unique string identifier to all API calls made within our application. This allows us to easily identify and group log entries made throughout our system – from the browser to our PHP logs to our API logs. Now tracking down a 500 error from the API is as easy as copying the context from the browser and searching our logs for it.
The context ID has three parts that show up in the response headers of API calls made from our application. These help give us more information about the call itself:
1. User ID: The first segment of each context is the ID of the user currently logged into our application, which makes it easy to find all requests made from a specific user’s account. This way, if a user experiences an issue with our system, we can easily view their full request history in our logs. If the API is called from something other than our front end that doesn’t have access to a user ID, we use the IP address of the service making the request.
2. MD5 Hash of Userd ID + Page URL: The second segment is an MD5 hash of the user ID and the URL of the page the request is being made from. This allows us to group requests made by a specific page in our system. For example, if a user is having trouble on MyCBI we can grep the logs to see all of the API calls made by the user from that page. Here is a snapshot of our logs with an identical middle segment, indicating they came from the same page within our application:
3. MD5 Hash of User ID and Timestamp: The last segment is an MD5 hash of the user id and the unix timestamp in milliseconds of when the call occurred – this part is purely for the purpose of making each identifier unique.
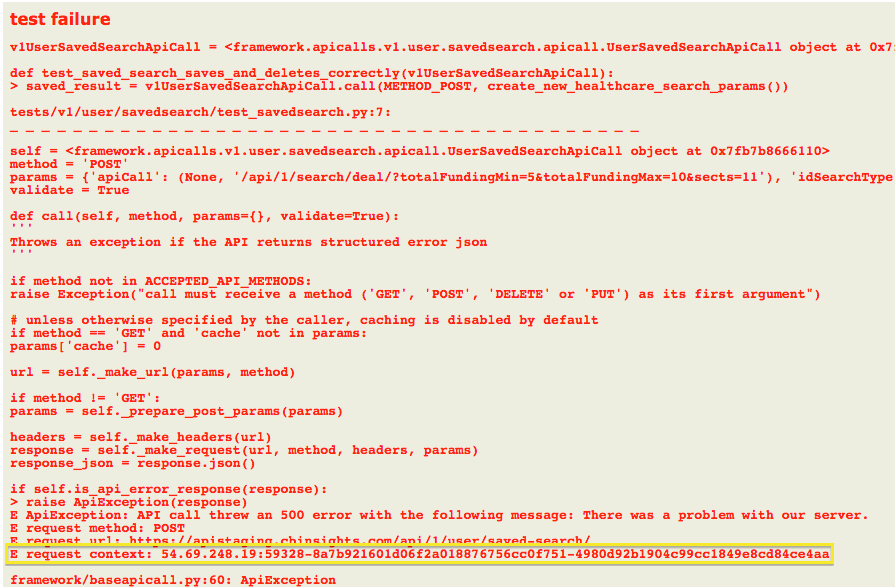
We also added this identifier to the output of our integration tests suite, which helps us jump right into the logs and start debugging if one of our tests fails.
Here is a snapshot of our test results which include the context identifier in the output:
This simple approach allows us to identify and trace three distinct but important logging cases: entries 1) specific to a user, 2) specific to page and 3) specific to a single API request. We’ve found this technique has already saved us time debugging and keeps our engineers sane while tracking down issues in our system.
Although this setup works great, there’s still ways we could improve our logging system. In the future, we’d like to setup a tool like Apache Kafka to help us aggregate our logs into a centralized location for easy access.
If you have any tricks for improving logs, we’d love to hear them – drop us a comment about it below. Or if any questions on our approach, feel free to chime in below.
And oh yeah, if you’d like to join a group of developers at CB Insights who are building a world class data and analytics platform, check out our jobs page.
Image credit: Wikimedia

